Using Categorical (Text) Data in SimDec
SimDec works with numeric input–output simulation data. If your dataset contains categorical or text variables, they must be converted to numbers before analysis. This post shows a simple and reliable way to do that.

Recommended Encoding Method
Encode categories based on their average output value. This will ensure nicely ordered visual decomposition.
The rule is simple:
Categories with lower average output get lower numbers.
Categories with higher average output get higher numbers.
Step-by-Step Encoding
Assume:
- a categorical input X
- an output variable Y
1. Compute Mean Output by Category
Calculate the mean of Y for each category of X.
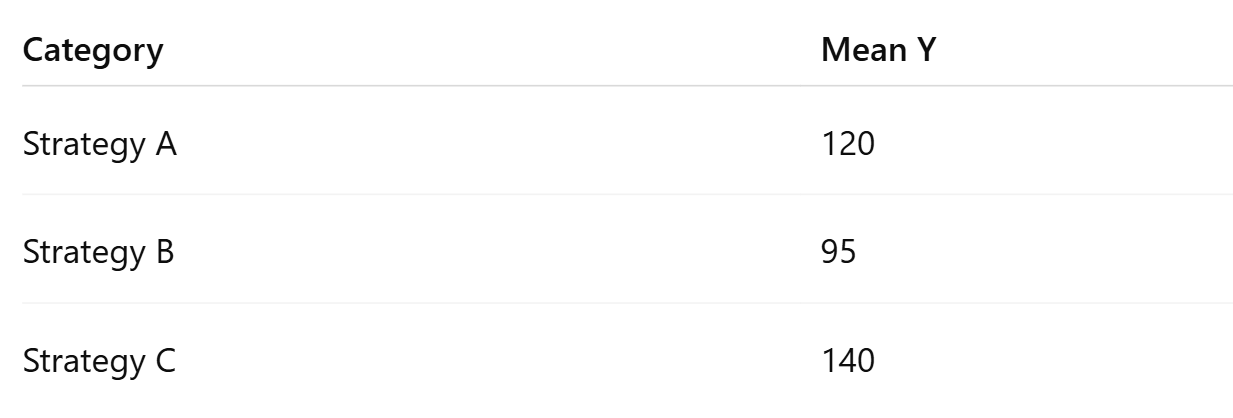
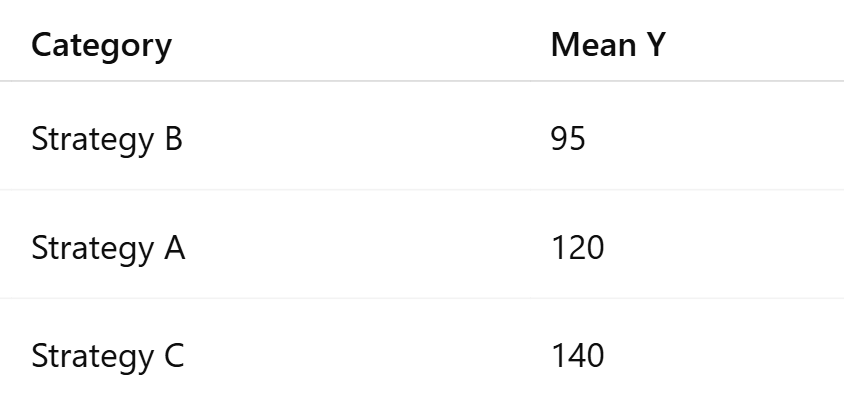
2. Sort Categories by Mean Output
Sort categories from lowest to highest mean.
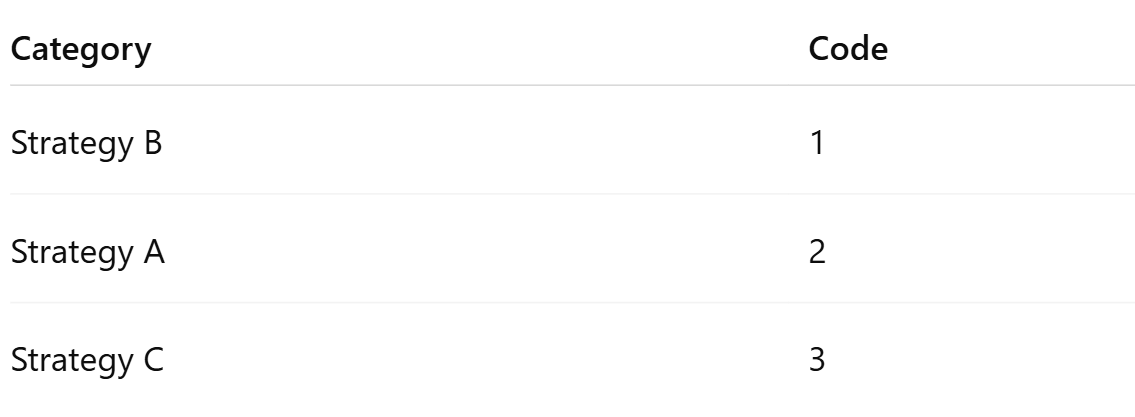
3. Assign Numeric Codes
Assign integers starting from 1.
4. Replace Text with Numbers
Replace all text values in the dataset with the assigned codes.

Notes
- Use the output of interest when computing means.
- If there are multiple outputs, encode using the primary one.
- Recompute the encoding if the simulation model changes.
Summary
To use categorical variables in SimDec:
- Compute mean output by category
- Sort categories by mean
- Assign numeric ranks
- Replace text values
Code examples
Python
import pandas as pd
# df columns: 'run', 'X', 'Y'
# Example: df = pd.read_csv("sim.csv")
# 1) mean output per category
means = df.groupby("X")["Y"].mean()
# 2) sort categories by increasing mean
ordered = means.sort_values().index
# 3) assign codes 1..K
code_map = {cat: i + 1 for i, cat in enumerate(ordered)}
# 4) replace X with numeric codes
df["X_encoded"] = df["X"].map(code_map)
# Optional: keep only numeric input if you want
# df = df.drop(columns=["X"])
print(code_map)
print(df.head())
R
# df columns: run, X, Y
# df <- read.csv("sim.csv", stringsAsFactors = FALSE)
# 1) mean output per category
m <- tapply(df$Y, df$X, mean)
# 2) sort categories by increasing mean
cats <- names(sort(m))
# 3) assign codes 1..K
code_map <- setNames(seq_along(cats), cats)
# 4) replace X with numeric codes
df$X_encoded <- unname(code_map[df$X])
print(code_map)
head(df)
MATLAB
% T is a table with variables: run, X (string/cellstr/categorical), Y (double)
% Example: T = readtable("sim.csv");
% Ensure X is categorical for grouping
T.X = categorical(T.X);
% 1) mean output per category
[G, cats] = findgroups(T.X);
meanY = splitapply(@mean, T.Y, G);
% 2) sort categories by increasing mean
[~, idx] = sort(meanY, 'ascend');
cats_sorted = cats(idx);
% 3) assign codes 1..K
codes = (1:numel(cats_sorted))';
% 4) replace X with numeric codes
% Build mapping via ismember
[tf, loc] = ismember(T.X, cats_sorted);
T.X_encoded = codes(loc);
% Optional: show mapping
mapping = table(cats_sorted, codes, 'VariableNames', {'Category','Code'});
disp(mapping);
head(T)
Excel
Assume your data is in an Excel Table named Sim with columns:
Sim[Simulation run]Sim[X](text categories)Sim[Y](output)
Step A — Create a mapping table (Category → MeanY → Code)
- List unique categories (e.g., in
H2):
=SORT(UNIQUE(Sim[X]))
- Mean output for each category (in
I2, next to the spilled list):
=AVERAGEIF(Sim[X], H2#, Sim[Y])
- Sort categories by mean (create sorted category list, in
K2):
=SORTBY(H2#, I2#, 1)
- Create codes 1..K (in
L2):
=SEQUENCE(ROWS(K2#))
Now you have a mapping table:
K2#= categories sorted by meanYL2#= numeric codes
Step B — Replace X with code (X_encoded)
Add a new column Sim[X_encoded] and use:
=XLOOKUP([@X], $K$2#, $L$2#)
That’s it: Sim[X_encoded] is your numeric version of X.