Exploring empirical data with SimDec
Having a sensitivity analysis method working on a given data opens up myriads of possibilities. One of them is analyzing empirical data instead of simulation.
When I was examining a Master’s thesis devoted to the relationship between interest rate derivatives and firm value for Finnish listed companies, I couldn’t help trying this dataset on the SimDec dashboard simdec.io. The thesis itself uses econometric models, but the data is already arranged as inputs and outputs in a table, which makes it perfectly suitable for sensitivity analysis too.
Preparing the data took almost no effort. The only thing needed was converting categorical variables into numeric ones so the dashboard could read them. After that, it was just a matter of uploading the CSV file.
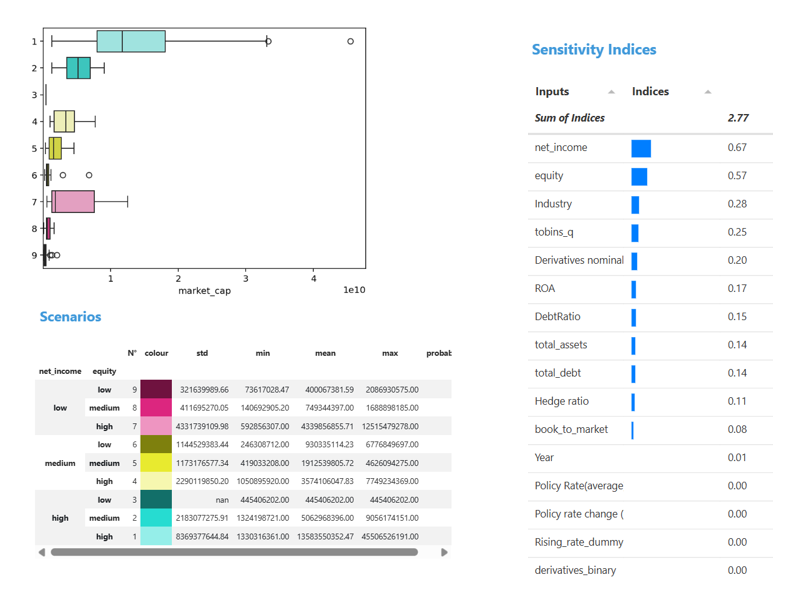
The results show several things that line up with the thesis conclusions. Firm fundamentals dominate the explanation of firm value: net income and equity clearly stand out as the most influential drivers of market capitalization. That matches both financial intuition and the regression results reported in the thesis.
At the same time, some differences appear. Variables related to derivatives have noticeably smaller influence, and macro variables such as policy rate indicators barely show up in the sensitivity indices. In the regression analysis of the thesis, these variables were part of specific hypotheses about hedging behavior and interest rate environments.
Why so? Firm-level fundamentals may simply dominate the variation in the data. Some macro variables may not change much across observations.
Let’s also see how the hedge ratio looks when contrasted with market capitalization. This can be easily done with the SimDec two-output plot.
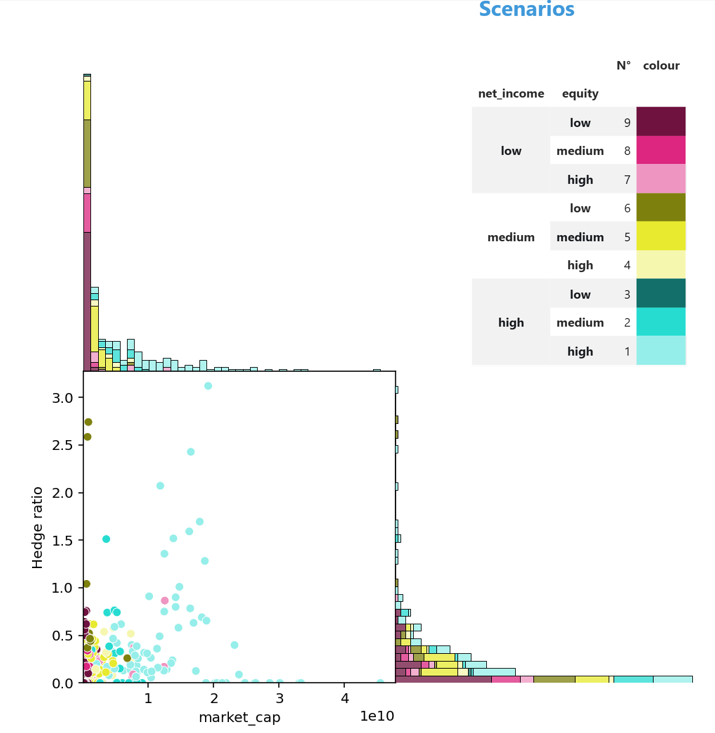
This adds one more nuance to the picture. For smaller firms, hedge ratio seems to have little visible relationship with firm value. Most observations are clustered near low market capitalization and low hedge ratios, without any clear pattern. In the subgroup of larger and financially stronger firms, especially those with high income and high equity, there are some signs of a more positive association. Still, the pattern is weak. It may simply reflect the fact that larger and stronger firms both hedge more and have higher market values, rather than a direct value effect of hedging itself.
The point here is not to replace the econometric analysis. The interesting part is how easily another analytical perspective can be added. Once the data exists, SimDec can be applied almost instantly to explore it. With very little preparation and a few clicks in the dashboard, it becomes possible to see what really drives the variation in the dataset and to compare that view with other analytical approaches.